Frontend Observability: Ensuring Seamless User Experiences

Frontend observability is a critical component of our observability strategy. It empowers us to deeply understand how users interact with our platform and ensures their experiences are smooth, responsive, and error-free. Since most of or applications have been decoupled from the backend, monitoring the frontend layer is as important as monitoring the backend.
Why Frontend Observability Matters
Frontend observability addresses key aspects of user experience by helping us answer questions like:
- Are pages loading fast enough?
- Are users encountering errors during interactions?
- Are animations and layouts visually stable across devices?
- What is the impact of third-party scripts on performance?
By focusing on real user behavior and browser-side performance, frontend observability helps us bridge the gap between backend operations and actual user experiences.
Key Components of Frontend Observability
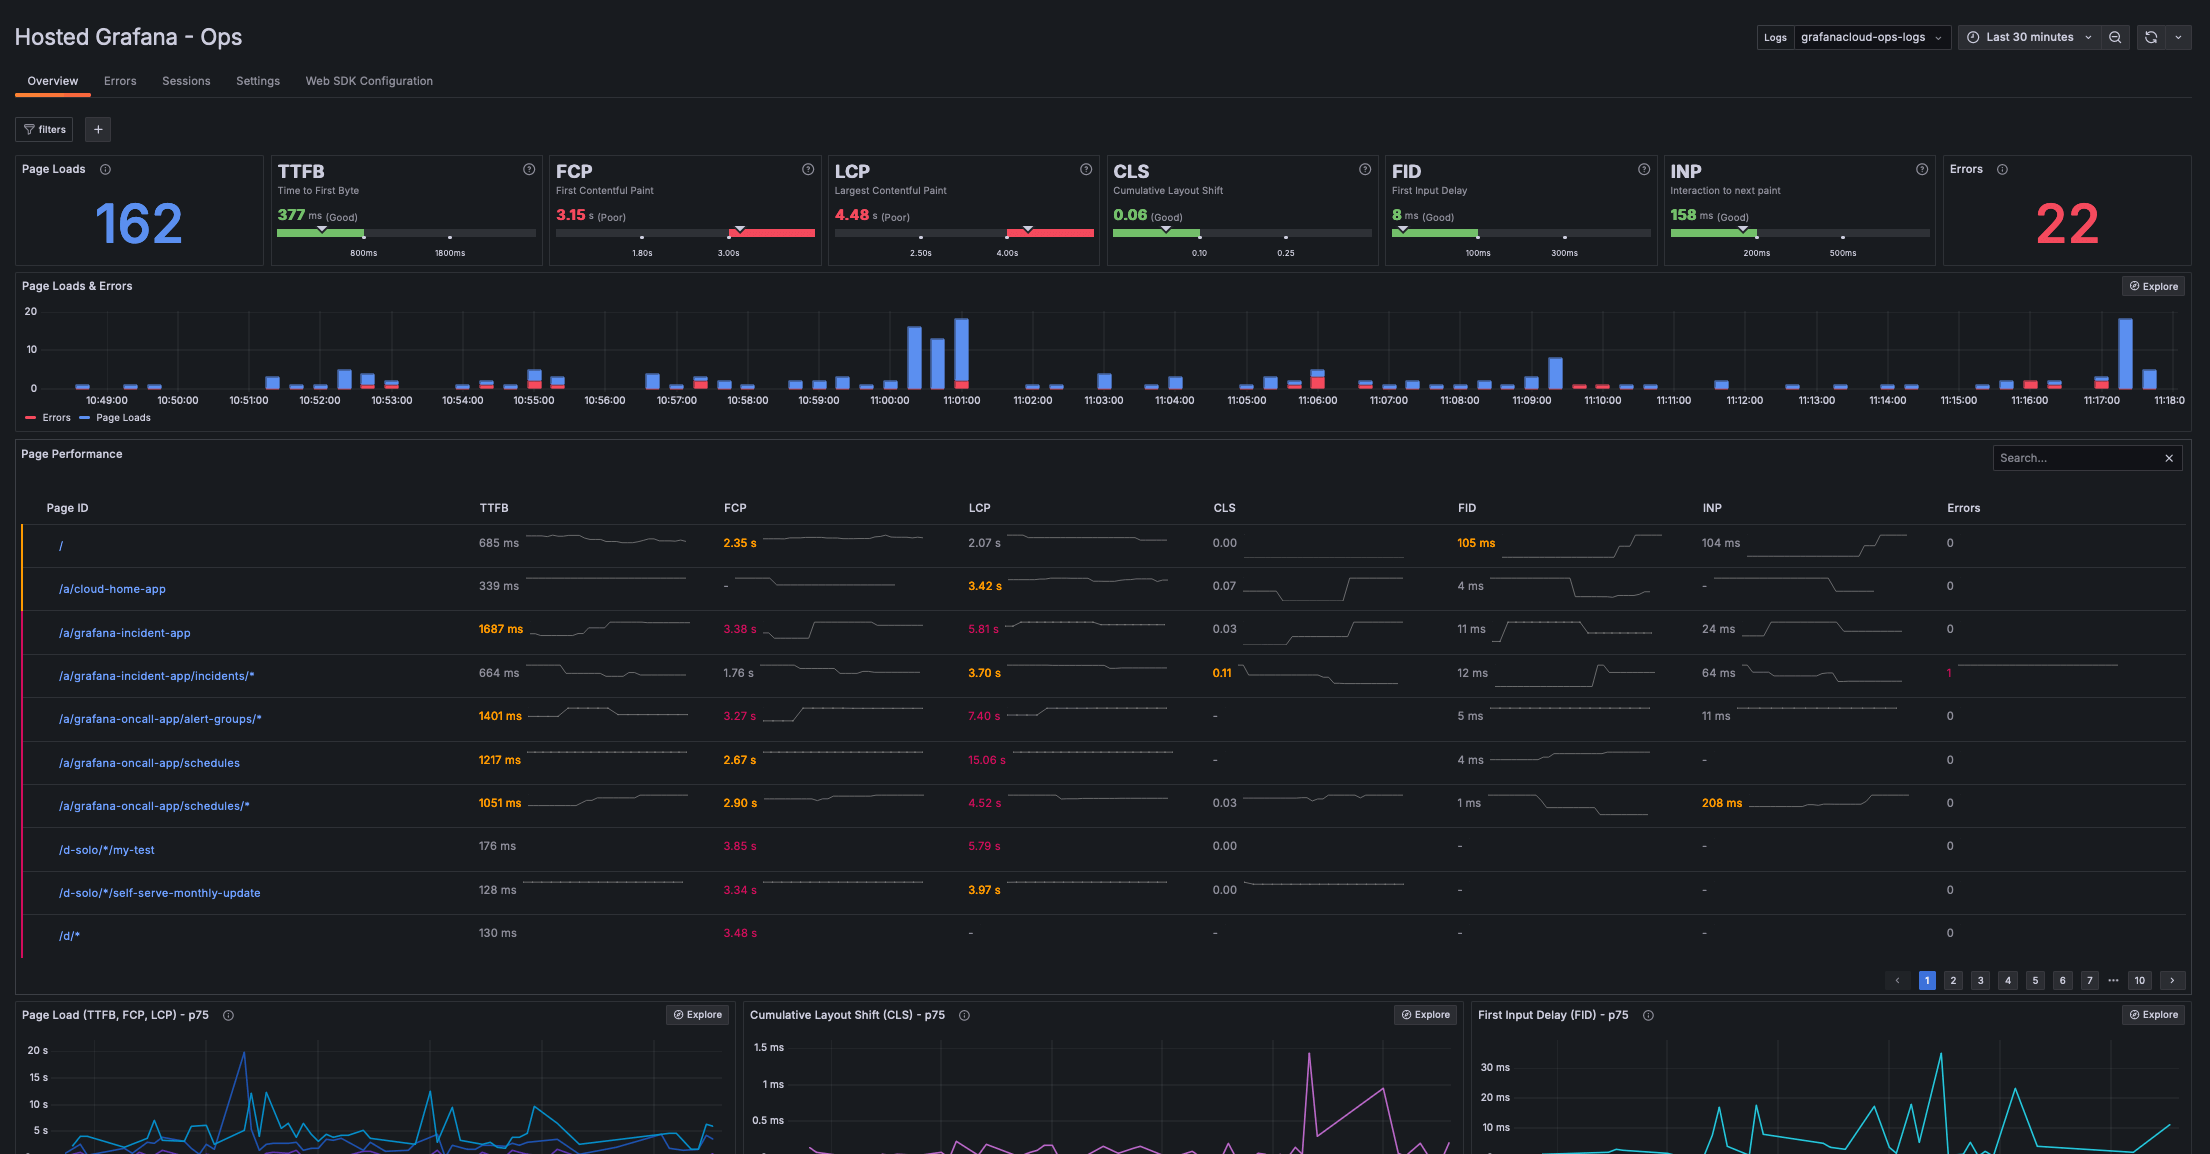
1. Core Web Vitals: Measuring User-Centric Performance
Core Web Vitals are foundational metrics for evaluating the quality of the user experience:
- Largest Contentful Paint (LCP): Measures the loading speed of the largest visible content block (e.g., an image or a heading). A fast LCP ensures users see meaningful content quickly.
- First Input Delay (FID): Captures the time it takes for the browser to respond to the user’s first interaction (e.g., clicking a button). Low FID ensures the site feels responsive.
- Cumulative Layout Shift (CLS): Tracks visual stability by measuring unexpected layout shifts during loading. A low CLS ensures content remains visually stable, reducing frustration.
These metrics help quantify critical aspects of user satisfaction, enabling us to proactively optimize our platform's performance.
2. Real User Monitoring (RUM): Understanding Real-World Interactions
RUM collects data directly from users' browsers, giving us a ground-level view of performance and usability. It helps us understand:
- How users from different locations and devices experience the site.
- The performance impact of slow networks or underpowered devices.
- Common paths users take through our platform and where they drop off.
By analyzing RUM data, we can detect regional issues, device-specific bottlenecks, and page-specific slowdowns.
3. Session Replay: Reconstructing User Journeys
Session replay tools capture and recreate user interactions on the frontend, providing an instant playback of user experiences. This includes:
- Mouse movements, clicks, and scrolls.
- Errors encountered during the session.
- Sequence of events leading to performance issues or crashes.
Session replays give us the context needed to resolve usability issues, debug client-side errors, and optimize workflows.
4. Synthetic Monitoring: Proactive Testing for Potential Problems
Synthetic monitoring simulates user interactions to detect problems before they affect real users. For example:
- Simulating a user logging in, browsing, or making a payment.
- Testing critical workflows across browsers, devices, and networks.
- Monitoring third-party dependencies like payment gateways or analytics scripts.
This allows us to ensure the platform is always ready for real users, even in varying conditions.
5. Error Monitoring: Detecting and Fixing Client-Side Issues
Frontend error monitoring captures JavaScript errors, unhandled promise rejections, and browser compatibility issues. With tools like source maps, we can trace back minified errors to their original code, enabling:
- Rapid debugging of errors seen by real users.
- Monitoring third-party library or plugin issues.
- Alerting for recurring errors or high-impact problems.
6. User Perception Metrics: Beyond Performance
Sometimes, what users feel about performance matters as much as the actual numbers. These include:
- Time to Interactive (TTI): How soon users can interact with a page.
- Perceived Speed Index: How visually complete the page appears over time.
- Smoothness: Frame rate and animation stability during interactions.
These metrics focus on how a user perceives the site, giving us insights into satisfaction and usability.
Frontend Observability in Action

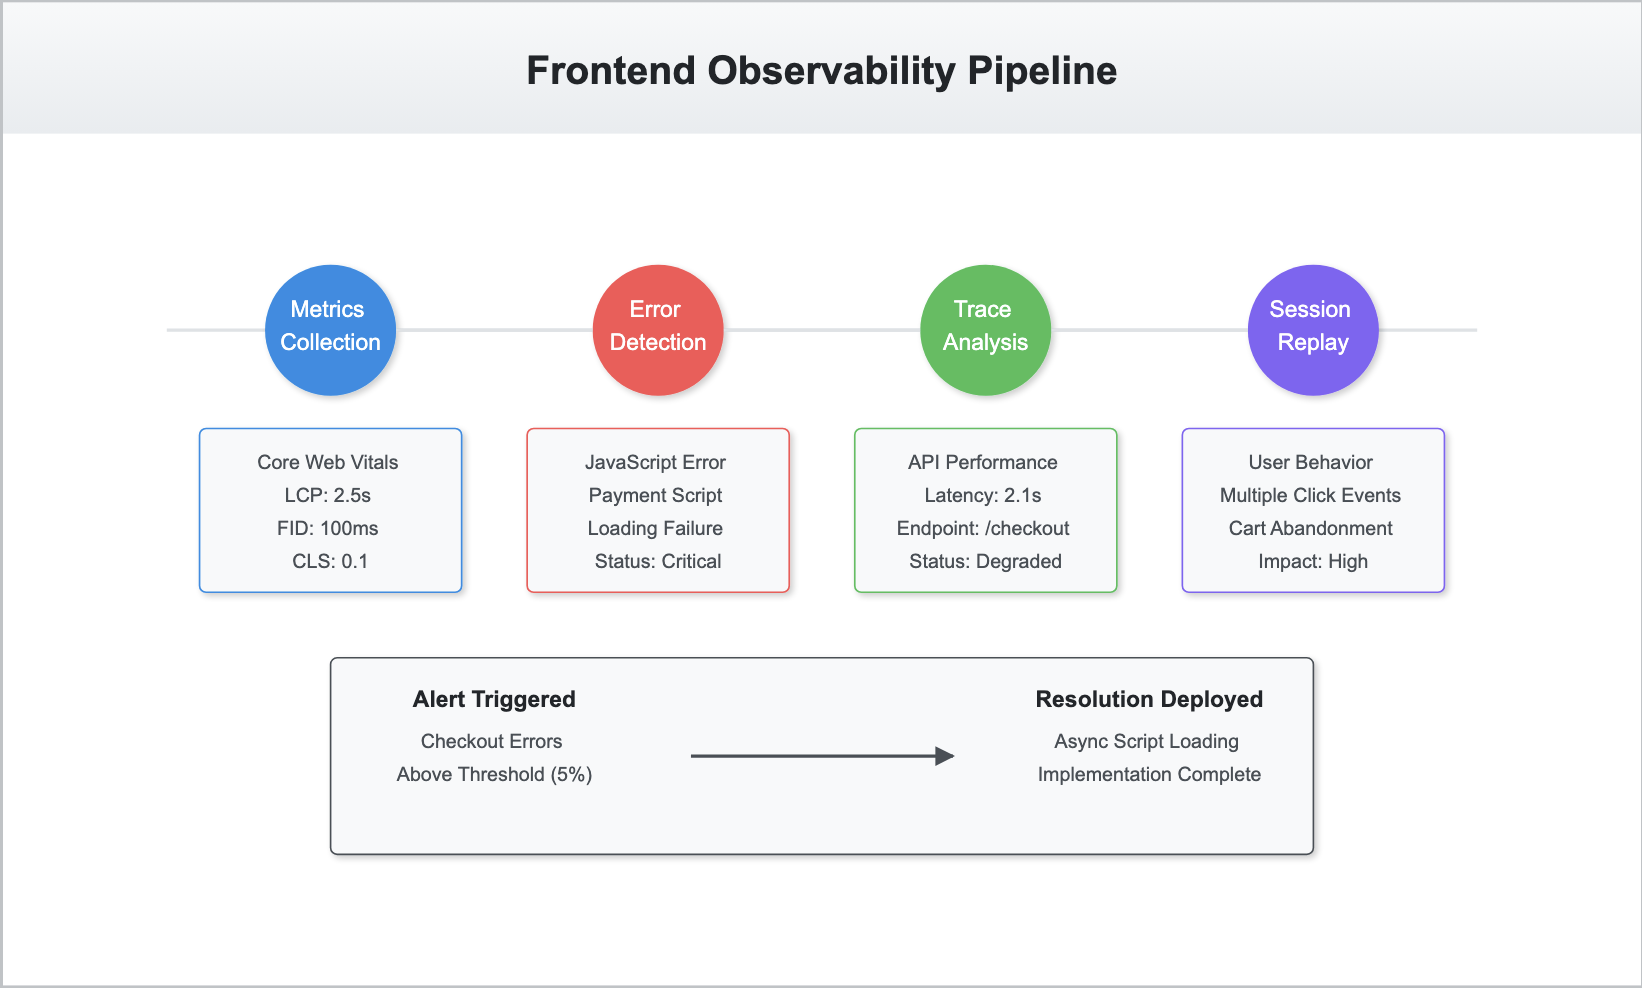
Let’s imagine a user visits the platform, searching for products and checking out. Here's how our observability pipeline might work:
Metrics Collection:
RUM captures the user's page load times (LCP), measures interaction delays (FID), and monitors layout stability (CLS).Error Detection:
An error is logged when the checkout page fails to load due to a client-side JavaScript issue.Traces and Logs:
Distributed tracing connects the dots between the user’s action (checkout button click) and backend API latency. Browser logs reveal the exact error and the code snippet causing the issue.Session Replay:
Replays show the user clicked multiple times on the checkout button before abandoning the session, hinting at frustration caused by the error.Alerts and Insights:
Alerts notify the engineering team of elevated checkout errors. Analysis reveals the issue stems from a third-party payment script failing to load.Optimization:
Engineers deploy a fix to load the payment script asynchronously, ensuring the checkout page remains functional.
By championing frontend observability, we ensure every interaction on our platform is delightful, performant, and reliable, aligning with our mission to drive Africa forward.
CHAT SAMMIAT

