Setting Up Default Instrumentation in OpenTelemetry in your .NET API's
The Hubtel.Otel.Instrumentation library configures tracing with various instrumentation and exporters:
- Console Exporter: Adds a console exporter if enabled in the configuration.
- ASP.NET Core Instrumentation: Adds instrumentation for ASP.NET Core.
- HTTP Client Instrumentation: Adds instrumentation for HTTP client with specific options.
- Redis Instrumentation: Adds instrumentation for Redis with specific options and configuration.
- Confluent Kafka Instrumentation: Adds instrumentation for Kafka.
- Entity Framework Core Instrumentation: Adds instrumentation for EF Core.
- Npgsql Instrumentation: Adds instrumentation for PostgreSQL.
- Elasticsearch Client Instrumentation: Adds instrumentation for Elasticsearch.
- RabbitMQ Instrumentation: Adds instrumentation for RabbitMQ.
- OTLP Exporter: Adds an OTLP exporter with the endpoint configured from
otelConfig.
This package should be sufficient for a startup project, covering about 80% of your instrumentation requirements.
1. Install Required Packages
dotnet add package Hubtel.Otel.Instrumentation2. Add to IServiceCollection in Program.cs or Startup.cs
services.AddHubtelOpenTelemetry(config);3. Add to appsettings.json
  "OpenTelemetryConfig": {
   "ServiceName": "Name of Project or Service",
   "Host": "localhost",
   "Port": 4317,
   "Protocol": "http",
    "ShowConsoleMetrics": false,
    "ShowConsoleTrace": true
 }
3. Run and Observe
Start the application, make requests, and observe telemetry data in the console or an observability connected backend.
Integrating with Observability Backends
OpenTelemetry supports a variety of backends, including:
- Jaeger: Distributed tracing visualization.
- Grafana: A multi-platform open source analytics and interactive visualization web applicatio
- Prometheus: Metrics storage and analysis.
- .NET Aspire Dashboard: Offer a sophisticated dashboard for comprehensive app monitoring and inspection, and it's also available in standalone mode.
- Loki: A horizontally scalable, highly available, multi-tenant log aggregation system
To use Aspire Dashboard
The .NET Aspire Dashboard is a powerful tool for visualizing telemetry data from applications instrumented with OpenTelemetry. Operating in standalone mode, it allows developers to monitor logs, traces, and metrics quickly with a simple docker container. Here's how to set up and use the Aspire Dashboard in standalone mode:
- Prerequisites
- Docker: Ensure Docker is installed on your system to run the dashboard container.
- OpenTelemetry-Instrumented Application: Your application should be configured to emit telemetry data using the OpenTelemetry Protocol (OTLP).
- Starting the Aspire Dashboard Launch the Aspire Dashboard using Docker with the following command:
docker run --rm -it -d -p 18888:18888 -p 4317:18889 --name aspire-dashboard mcr.microsoft.com/dotnet/aspire-dashboard:9.0After running the command, access the dashboard UI by navigating to http://localhost:18888 in your browser.
- Configuring Your Application to Send Telemetry
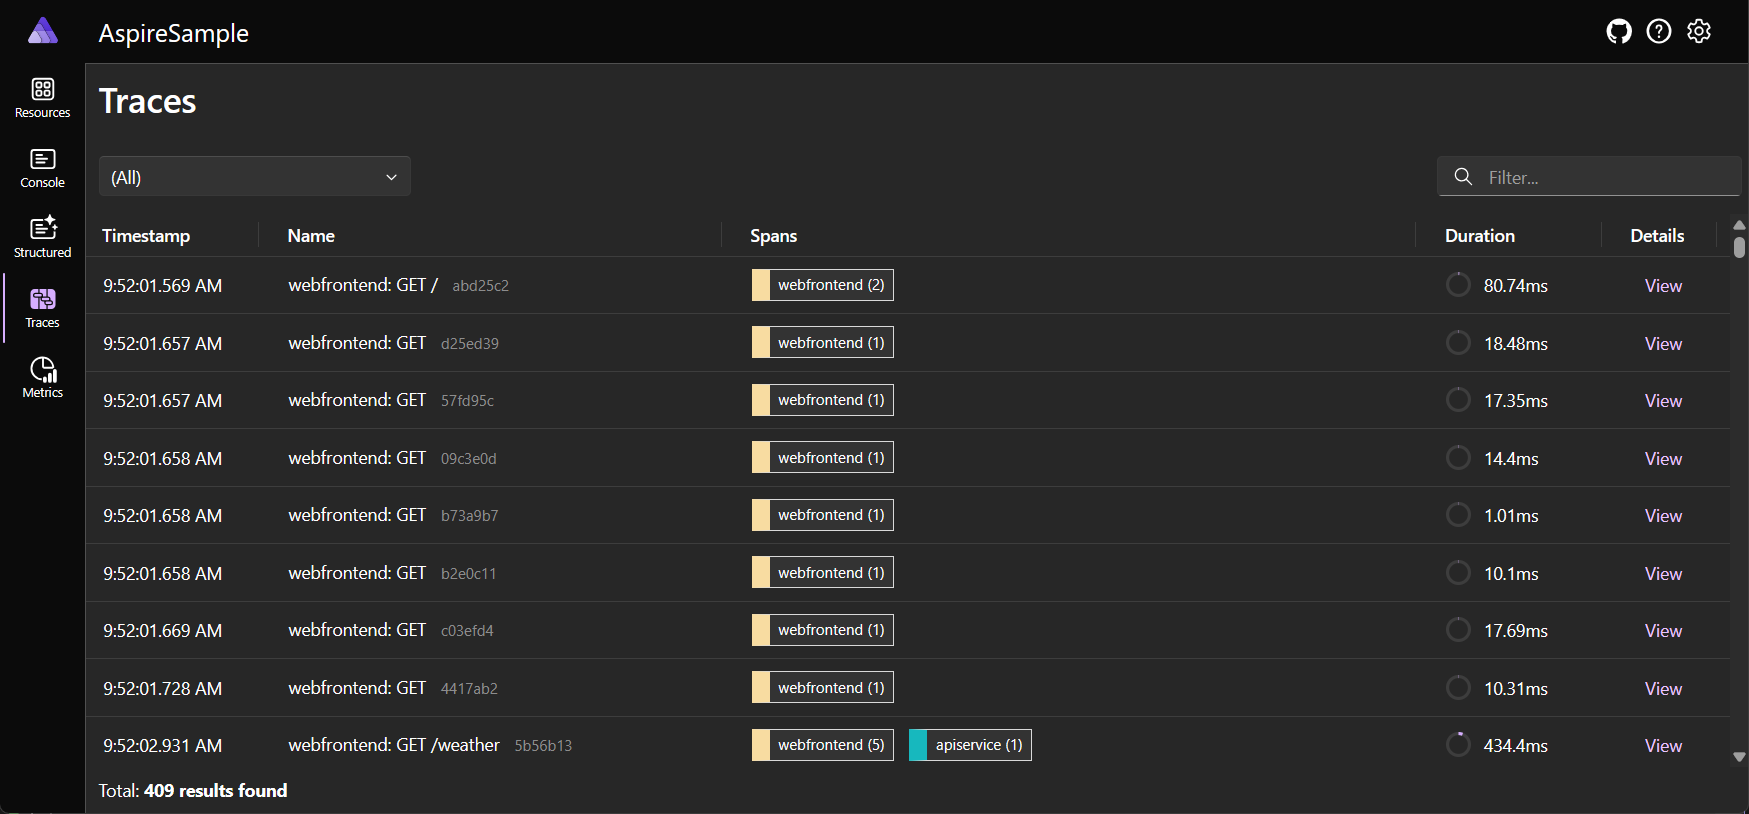
Configure your application to send telemetry data to the dashboard's OTLP endpoint (http://localhost:4317). If your app is instrumented properly, you should see something similar to the image below:

To use the Grafana Stack
To use the Grafana stack for OpenTelemetry (OTel) in a .NET application, you can set up the complete observability pipeline, including Grafana, Prometheus,Loki, Tempo and an Otel Collector. Here’s a step-by-step guide:
- Prerequisites
- Docker: Ensure Docker is installed on your system to run the dashboard container.
- OpenTelemetry-Instrumented Application: Your application should be configured to emit telemetry data using the OpenTelemetry Protocol (OTLP).
- Set Up the Grafana Stack The Grafana stack typically consists of:
- Grafana: For visualization.
- Prometheus: For metrics collection and storage.
- Tempo: For distributed tracing.
- Loki: For logs aggregation (optional).
a) Create docker-compose.yml
Create a docker-compose.yml file to set up Grafana, Prometheus, and the OpenTelemetry Collector:
version: '3.8'
services:
  prometheus:
    image: prom/prometheus:latest
    container_name: prometheus
    volumes:
      - ./prometheus.yml:/etc/prometheus/prometheus.yml
    ports:
      - "9090:9090"

  grafana:
    image: grafana/grafana:latest
    container_name: grafana
    ports:
      - "3000:3000"
    environment:
      - GF_SECURITY_ADMIN_USER=admin
      - GF_SECURITY_ADMIN_PASSWORD=admin
    volumes:
      - grafana-data:/var/lib/grafana

  otel-collector:
    image: otel/opentelemetry-collector:latest
    container_name: otel-collector
    ports:
      - "4317:4317"
      - "55680:55680"
    volumes:
      - ./otel-collector-config.yml:/etc/otel-collector-config.yml
    command:
      --config=/etc/otel-collector-config.yml

volumes:
  grafana-data:
b) Create prometheus.yml
Define a prometheus.yml file for scraping metrics:
global:
  scrape_interval: 5s

scrape_configs:
  - job_name: "otel"
    scrape_interval: 5s
    static_configs:
      - targets: ["host.docker.internal:9464"]
c) Create otel-collector-config.yml
Configure OpenTelemetry Collector:
receivers:
  otlp:
    protocols:
      grpc:
      http:

exporters:
  logging:
    loglevel: debug
  prometheusremotewrite:
    endpoint: "http://prometheus:9090/api/v1/write"

service:
  pipelines:
    metrics:
      receivers: [otlp]
      exporters: [prometheusremotewrite]
    traces:
      receivers: [otlp]
      exporters: [logging]
Step 4: Start the Stack
Run the stack using Docker Compose:
docker-compose up -dStep 5: Access Grafana
- Open Grafana at http://localhost:3000.
- Log in with:
- Username:
admin - Password:
admin
- Username:
- Add Prometheus as a data source:
- Navigate to Configuration > Data Sources.
- Select Prometheus and set the URL to
http://prometheus:9090.
- Create dashboards to visualize traces and metrics.
Step 6: Test the Setup
Run your .NET application and ensure that traces, metrics, and logs are being sent to Grafana.
CHAT SAMMIAT
